Abstract
This paper reviews the relationship between modern social classification, the resulting structural change and its link to the Kuznets Wave Hypothesis. The major focus of this review is to determine other factors beyond industrialization that can necessitate a narrowing effect on Income Inequality contrary to the Kuznets’s Wave Hypothesis that states that the income gap between the rich and poor will typically reduce with increasing industrialization and as more workers join the work force. We also further dissected the form of industrialization that will change the needle in the income disparity dynamics.
Keywords: Social Stratification, Structural Change, Income Inequality, Kuznets Wave Hypothesis
Introduction
Historically, stratification systems were defined by roles relating to function, exploitation, and power distribution (Marx, Durkheim, Weber). However, in modern society, the classification focus has shifted, with social layers measured increasingly by poverty and economic vulnerability, reflecting persistent structural shifts. These structural changes evident in globalization, industrialization, and high levels of social migration has not appreciably narrowed the gap between the poor and the rich. Instead, the disparity continues to widen despite the persistent structural shifts in social strata.
This trend is reflected in the reported low social mobility perception in a 2023 World Economic Forum report which highlights that only 15% of people in developed nations believe their children will achieve a better standard of living than they have.
According to the World Bank (2023), approximately 689 million people, or 9.2% of the global population, live on less than $1.90 a day, underscoring the prevalence of chronic poverty, primarily in sub-Saharan Africa and South Asia. To better capture this dynamic, modern social classifications now categorize individuals based on livelihood and consumption patterns as: the chronically poor (expected consumption below the poverty line, unlikely to exit poverty), the transient poor (consumption levels fluctuate around the line), and the vulnerable (consumption above the line but susceptible to economic shocks).
This focus has expanded through the Multidimensional Poverty Measure (MPM), which incorporates access to education, healthcare, and basic infrastructure alongside monetary measures to determine poverty. Surprisingly, the updated MPM now reveals that 1.3 billion people (or 22% of the population in developing countries) experience multidimensional poverty, and nearly 39% of these individuals would not be identified by monetary poverty alone, highlighting the insufficiency of simple income metrics.
This pronounced global trend—substantiated by the IMF’s 2023 report that income inequality has increased by 11% globally since the millennium—necessitates a critical re-evaluation of classical theories like the Kuznets Hypothesis.
Simon Kuznets’s Hypothesis (1955) famously posited that income inequality follows an inverse U-shape during development, first rising with industrialization and then declining as depicted below.
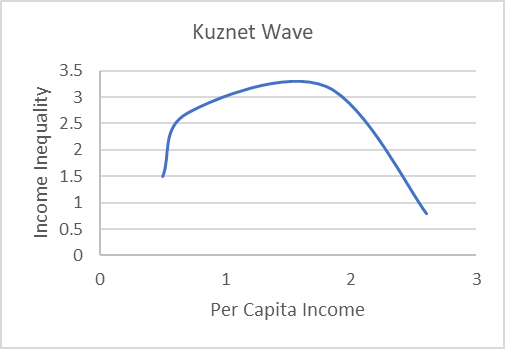
While early studies confirmed this pattern between 1915 and 1948, recent findings suggest a new Kuznets Wave that contradicts the original hypothesis, showing no evidence of reduced income inequality at advanced stages of growth (Milanovic, 2016).
Literature Review
A.I New Perspective on the Kuznet’s wave hypothesis
The new Kuznets wave challenges the current body of research on income inequality in advanced stages of economic growth, arguing that there is no evidence to support the idea of reduced income inequality during such stages. Instead, evidence indicates there is reduced income inequality at advanced stages of growth except under other conditions as inferred in this research, which introduces a new perspective to the Kuznets hypothesis.
Milanovic (2016) identified several factors that sparked the new wave: economic policies, especially in wealthy countries, technological progress, and the decline of unionization and globalization. These factors will determine the reduction or increase in income inequality in a nation. Further studies in this research shows that it is the combination of these factors that can influence the movement of income inequality and there is no direct relationship between growth and income inequality. In most cases, from studies and additional research, the gap further widens with income growth except in rare situations. In the Milanovic,2016 studies, the winners from “high globalization” are only the global top 1% (super-rich) and the middle classes in emerging Asia, particularly China who got additional wealth as a result of increased globalization and economic growth. On the contrary, the middle class in developed countries continued to grow with no mobility into the upper middle class or high-income bracket as a result of advanced economic growth. Likely as a result of the economic policy influence in such countries such as tax policies which makes the rich richer and the poor poorer regardless of the increasing per capita income.
These facts show that income inequality in advanced stages of growth remains significant and differs country to country, contradicting Kuznets’s old hypothesis, which suggests that as income per capita rises, especially in advanced stages of growth the income inequality gap narrows.
Interestingly, the old Kuznets hypothesis remains applicable to poor countries at the initial stages of growth wherein economic growth is associated with rising income inequality, as further confirmed by the World Bank’s Multidimensional Poverty Index. The hypothesis is false for advanced economies in the late stages of growth especially the part of the U-curve that declines during the third stage of growth depending on several factors that will be reviewed in this paper.
A.II Conditional Drivers of Inequality (Beyond Income)
The trajectory of income inequality is substantially influenced by socio-demographic and structural factors that operate independently of aggregate income growth. A robust connection exists between variables like generational shifts (e.g., changes in labor force participation and retirement patterns), population structure, social stratification, and the stage of industrialization (or deindustrialization). However, the precise magnitude and heterogeneity of these causal pathways require further empirical investigation to provide granular, country-specific policy insights.
A.III Structural Shifts and the Kuznets Inversion Failure
The structural composition of an economy dictates the validity of the Kuznets hypothesis in its advanced stages. While the original hypothesis posited that industrial maturity was the factor responsible for the narrowing of the income gap, many advanced economies now exhibit low levels of industrialization due to a fundamental shift from the manufacturing base to the service sector. This structural transformation, often characterized by a dual labor market (high-skill, high-wage vs. low-skill, low-wage services), can counteract the income-leveling forces predicted by Kuznets, potentially causing the inequality curve to spread or flatten rather than decline.
- A.IV Policy Focus: Distributive Justice and Acceptable Inequality
Achieving complete income equality is arguably an unattainable ideal, regardless of the stage of economic development. Consequently, the focus of policy and research should shift from purely achieving equality to ensuring distributive justice. This involves prioritizing a continuous, targeted commitment to combating poverty alongside implementing effective mechanisms for reasonable wealth and income redistribution to narrow the gap to socially and economically acceptable levels.
III. Data and Methods
This study re-examines the relationship between economic growth and income inequality by analyzing data from six diverse nations: The United States, South Korea, Germany, India, China, and South Africa.
A.I Data and Periodization
The analysis utilizes two key economic indicators: Gross Domestic Product (GDP) per capita (as a proxy for income growth) and the Gini coefficient (as the measure of income inequality). To capture distinct global economic eras and policy cycles, the data is segmented into three specific periods:
- Pre-Millennium: 1991–2000
- Post-Millennium: 2001–2010
- Digital/Post-Pandemic Age: 2011–2023
A.II Three-Stage Analytical Framework
The investigation proceeds through a structured, three-level analytical framework:
- Exploratory Trend Analysis: This stage involves an exploratory time-series analysis to identify and map the longitudinal trends and patterns in GDP per capita and the Gini coefficient for each country across the three defined periods.
- Descriptive and Correlational Analysis: The second stage employs descriptive statistics to calculate the period-specific mean for each variable. This is followed by a simple bivariate correlation analysis to quantify the strength and direction of the linear relationship between GDP per capita and the Gini coefficient within each period. This correlation specifically serves to contextualize and guide the subsequent investigation of outliers.
- Conditional Factor and Outlier Analysis: The final stage focuses on outlier observations and deviations from expected theoretical curves (e.g., the Kuznets hypothesis). The analysis uses Simple Linear Regression (SLR) techniques to test hypotheses regarding conditional factors. These factors include measures of social stratification, the rate of in-country industrialization (manufacturing), and an indicator proxying the dominant economic system implemented in each country.
A.II a: TRENDS AND CORRELATION
Our review of the income inequality gap, utilizing data from six diverse countries, reveals a predominant increasing trend in income inequality across the sample. The only nations maintaining a consistently acceptable Gini coefficient within the study are Norway and the Netherlands; while this outcome may be linked to specific demographic factors, such as their relatively smaller population sizes, a detailed analysis of population impact is beyond the scope of this paper. This finding is consistent with broader global assessments. The International Monetary Fund (IMF) recently reported in 2023 that global income inequality has escalated by 11% since the turn of the millennium, a trend that was particularly exacerbated by the economic shockwaves of the COVID-19 pandemic. Please find the breakdown of the investigation below:
- Pre-Millennium Years 1991-2000: The nineties period was marked by an end to the cold war between the United States and the Soviet Union. There was an increase in globalization and economic shifts, as well as recovery, especially in China and India. A few financial crises, the internet boom, and the anticipation of the millennium bubble also characterized the period. Income inequality generally widened, even in high-income countries, during the advanced stages of growth.
- Table I, Figure II: CHINA
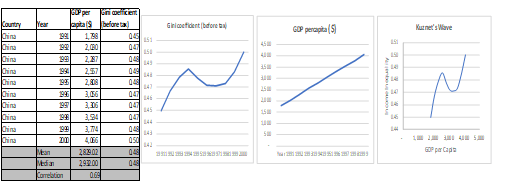
Source: World Inequality Database, Visualization by the author.
China’s income inequality pattern during this period largely conformed to the upward-sloping phase of the Kuznets hypothesis, characterized by a rising trend in the Gini coefficient. This movement aligns with the wave-like trends observed in later studies of income inequality. This era was defined by China’s momentous transition from a planned economy to a market-oriented system, which spurred rapid economic growth. Key drivers included accelerated industrialization, expansion of the private sector, surging Foreign Direct Investment (FDI) flows, and a substantial 126% cumulative increase in GDP per capita from 1991 to 2000.
However, the continued widening of income inequality during this rapid growth phase does not necessarily contradict the Kuznets hypothesis, but rather places China squarely in the model’s initial stage of rising inequality. The economy, while rapidly expanding, was not yet structurally mature or advanced enough to reach the hypothetical inflection point where the income gap is expected to narrow. The observed 69% correlation coefficient reinforces this finding, indicating a moderate, positive relationship where income growth and inequality generally increased in tandem.
- Table 11, Figure III: INDIA
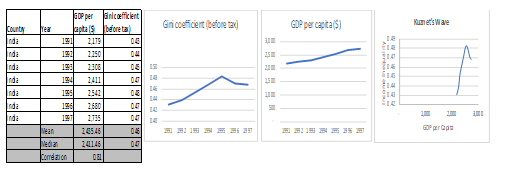
Source: World Inequality Database, Visualization by the author.
India experienced steady GDP per capita growth throughout this period, primarily driven by major economic reforms—specifically liberalization, privatization, and globalization—which significantly accelerated national development. Income inequality, as measured by the Gini coefficient, steadily escalated until 1995 before exhibiting a gradual, temporary decline, reaching a low of 0.47 by 1997, a movement that can be attributed to the implementation of favorable, counter-distributive policy changes enacted during that brief interval.
- Post Millennium Years (2001-2010): The first decade of the twenty-first century (2001–2010) was defined by two distinct phases: an initial economic boom that spanned the first seven years, abruptly followed by the 2008 global financial crisis. This crisis exerted a significant and immediate negative impact on advanced economies, particularly the United States. In contrast, emerging economies such as China and South Korea sustained their growth trajectory despite the global economic downturn. Critically, during both the preceding boom and the subsequent crisis, income inequality persisted and widened across all studied economies, with no notable difference in the inequality trend observed between the periods of rapid expansion and financial distress.
- Table III, Figure IV: USA
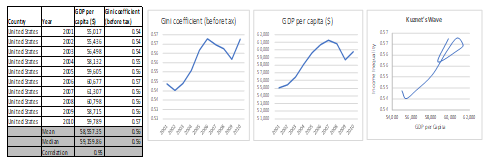
Source: World Inequality Database, Visualization by the author.
The 2008 global financial crisis had a pronounced and immediate impact on the United States, visibly reflected by the steady decline in its GDP per capita in both 2008 and 2009. Concurrently, this economic shock led to a 0.01-point reduction in the Gini coefficient (or 100 basis point reduction in the income inequality gap). For a country with an already high Gini coefficient, this seemingly small decrease is considered significant, as that 1% drop effectively represented an approximate 3% share of income gain for the poorest segments of society. Research from the Congressional Budget Office (CBO) attributed this temporary narrowing of the income gap primarily to the substantial 36% income loss experienced by the nation’s highest earners, rather than to gains among lower-income groups. This mechanism starkly illustrates that the reduction in inequality was driven by financial compression at the top rather than by equitable income distribution or policy intervention.
- Table IV, Figure V: SOUTH AFRICA
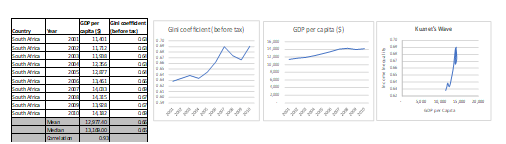
Source: World Inequality Database, Visualization by the author.
South Africa’s GDP per capita followed the same pattern as the United States post-millennium, with significant declines observed from 2007 to 2009. This trend contrasted with those of already classified emerging economies, such as South Korea and China, during the same period. South Africa joined the BRICS alliance in 2010, but had not yet developed sufficient economic resilience to withstand the shocks of the 2008 global financial crisis. Income inequality declined between 2007 and 2008, primarily due to the impact of the financial crisis and the global recession. The 200-basis-point decrease is notably substantial for an economy with a very high Gini coefficient, averaging around 0.65. This decline could not be sustained, as the country’s economic expansion in 2010 reversed the trend at an equivalent rate. Redistributive fiscal policies and economic growth did not result in proportional benefits for the entire population.
- Digital Age and Post-Pandemic (2011-2023): The period spanning 2011 to 2023 was initially characterized by a general economic recovery following the 2008 financial crisis. This recovery coincided with the rapid ascent of digital technologies, particularly within the finance sector, which sought to improve security and efficiency as part of the post-crisis reform efforts. However, this progress was dramatically interrupted between 2020 and 2023 by the COVID-19 pandemic. This major global disruption constituted a dual crisis—a public health emergency and a severe economic shock—leading to unprecedented supply chain issues, widespread market volatility, and a sharp, synchronized global downturn.
- Table V, Figure VI:GERMANY
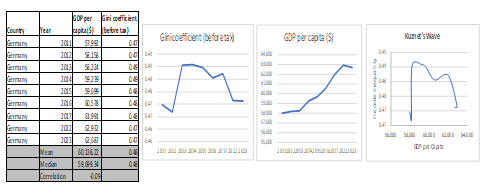
Source: World Inequality Database, Visualization by the author.
Germany successfully sustained its economic recovery from the 2008 global financial crisis up until 2019. However, this growth trajectory was sharply interrupted by the COVID-19 pandemic, resulting in a significant drop in GDP per capita from $62,971 in 2019 to $60,343 in 2020. A quick rebound in 2021 saw GDP per capita recover to $62,531, but subsequent growth proved unsustainable, and per capita GDP has since remained relatively flat.This stagnation is attributable to a confluence of persistent economic headwinds, including: the impact of the Ukraine war, historical reliance on Russian energy imports, a decline in the construction sector, growing concerns over deindustrialization leading to potential job cuts, and sustained high inflation. Despite this economic volatility, the income inequality gap, as measured by the Gini coefficient, demonstrated a favorable and consistent trend, steadily narrowing by approximately 100 basis points (0.01 points) year-over-year, ultimately concluding the period at a Gini coefficient of 0.47.
- Table VI, Figure VII: SOUTH KOREA
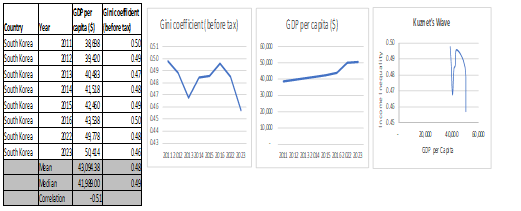
Source: World Inequality Database, Visualization by the author.
South Korea demonstrated considerable economic resilience throughout the 2011–2023 period, successfully navigating the challenges posed by both the 2008 global financial crisis and the COVID-19 pandemic. GDP per capita experienced substantial year-on-year growth during this interval, a performance supported by a convergence of factors: proactive national health measures, robust household support initiatives, the strategic launch of the Korean New Deal, powerful export sector performance, and strong macroeconomic fundamentals. However, despite this sustained economic expansion, the Gini coefficient exhibited a cyclical trend, indicating that income inequality movements were largely decoupled from the growth of GDP per capita during this period as with Germany and further evidence with the correlation coefficient of -0.51.
A.II-b IMPACT OF STRATIFICATION AND STRUCTURAL CHANGE
We analyzed the United States’ income categories and the percentage of income contributed by each social class and the results suggests that a significant portion of the economy remains vulnerable due to the growing income inequality gap, despite lower and middle-income segments collectively accounting for a large share of overall GDP. This conclusion is corroborated by recent public perception data. A 2023 survey from the Pew Research Center, which focused on self-identification with social class, indicated that a total of 120% of adults identified across four primary categories: 29% identified as middle class, 40% as working class, 45% as lower class, and 6% as upper class. The high collective identification across the lower and working classes underscores a broad public sense of economic precarity and class stratification within the U.S. economy.
Table VII: United States Stratification Data Table VIII: Germany Stratification data
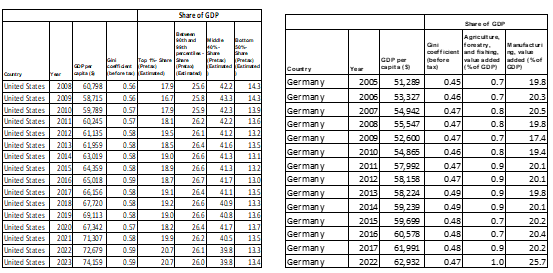
Source: World Inequality Database, Visualization by the author.
It can be inferred that the structural economic changes observed in most advanced nations have not resulted in a significant or consistent impact on the Gini coefficient. During this period, the contribution of the agriculture sector gradually diminished, and, critically, the manufacturing sector’s share of GDP often stabilized or declined as the service sector expanded dramatically. This fundamental shift in the economic structure—deindustrialization coupled with a rise in high- and low-skill services—did not necessarily lead to the expected narrowing of the income disparity between the wealthier and poorer segments of the population.
- A.II-c REGRESSION ANALYSIS
In my first regression analysis, we analyzed how industrialization affects income inequality using the industry added value figures of China from 2004 to 2023. This factor was regressed along with the GDP per capita against the dependent variable, the Gini coefficient to determine how much these two factors affect income disparity. In the second analysis, the effect of the type of economic systems was added to the variables using South Korea’s numbers, to also examine the effect of government actions and level of government dependence on income disparity.
Table IX: EFFECT OF INDUSTRIALISATION
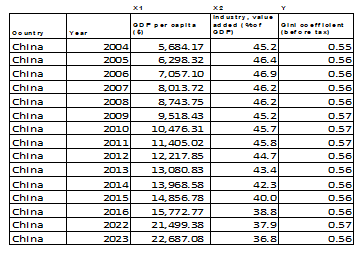
Source: World Inequality Database, Visualization by the author.
China’s Gini Coefficient, GDP Per Capital and share of industry value added was analyzed across fifteen data points to determine if a relationship exists between the industrialization level of a country and the income inequality. China’s GDP per capita rose from approximately $5.600 in 2004 to over $22,000 in 2023, reflecting rapid industrialization and economic expansion (World Bank, 2024). However, during this same period, the Gini coefficient in China hovered around 0.55 to 0.57 between 2004 and 2023. The effect of industrialization was seen between 2012 and 2016 indicating a marginal narrowing income gap.
China’s shift from agriculture to manufacturing in urban areas has often left rural workers behind, exacerbating inequality. In the U.S., real GDP per capita rose from approximately $36,300 in 2000 to nearly $60,000 in 2021 (Bureau of Economic Analysis, 2022), fueled by technology and service-sector growth. Simultaneously, income inequality widened, with the Gini coefficient rising from 0.40 in 2000 to 0.49 in 2020 (Census Bureau, 2022). The top 10% of earners captured nearly 50% of the total income, reflecting a stark disparity (Piketty & Saez, 2020). The shift from manufacturing to service-oriented industries has left behind lower-skilled workers, contributing to increasing inequality contrary to the Kuznets’s hypothesis.
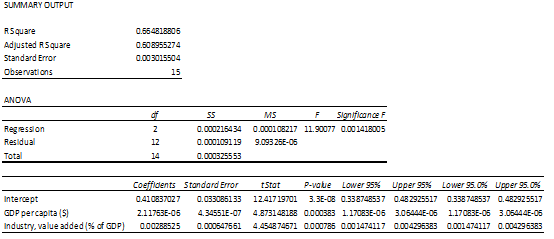
Results
Outcome=β0+β1(Industry)+β2(GDP per capita)+ϵ
Source: World Inequality Database, Visualization by the author.
This regression model shows that the relationship between the dependent variable (Gini Coefficient) and the Independent variables (Industry Value Added and GDP per capita is statistically significant and about two-thirds of the variation in the dependent variable can be reasonably explained by the two independent variables. Both variables showed a positive relationship with the dependent variable, meaning an increase in either one is associated with an increase in the dependent variable.
Based on the R square value, approximately 66.5% of the variation in the Gini Coefficient is explained by the GDP per capita and Industry, value added. We can conclude that both the GDP per capita and Industry, value added are statistically significant predictors of the outcome variable (Income inequality). The GDP per capita ($) and industry value added p values of 0.0003 and 0.0007are highly significant (p<0.05). This means that for every one-dollar increase in GDP per capita, the dependent variable is predicted to increase by a very small amount (0.000002118), assuming Industry value added is held constant and for every one-percentage-point increase in Industry value added as a share of GDP, the dependent variable is predicted to increase by 0.002885, assuming GDP per capita is held constant.
- Table IX: EFFECT OF TYPE OF ECONOMIC SYSTEM TYPE
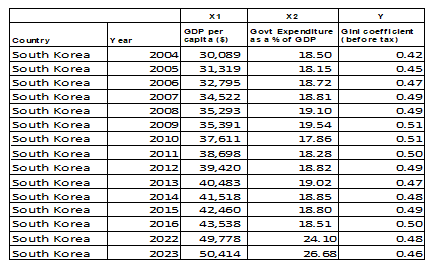
Source: World Inequality Database, Visualization by the author.
South Korea initially recorded high income inequality from 2004, which gradually declined from 2009 as a result of increased social policies and economic redistribution. The Gini Coefficient, GDP Per Capital and Government expenditure as a share of GDP was analyzed across fourteen data points to determine if a relationship exists between the economic systems/ policies and the income inequality.
South Korea’s GDP per capita rose from approximately $30,000 in 2004 to over $50,000 in 2023, reflecting rapid growth and development. The Gini coefficient began to decline from 2010 gradually as the impact of the government system and policies began to narrow the gap between the rich and the poor. This is significant because in comparison to other countries with a different structure and economic system like United States of America, the growing GDP per capital did not result into any significant decrease in the Gini Coefficient.
Results
Outcome=β0+β1(Economic System)+β2(GDP per capita)+ϵ
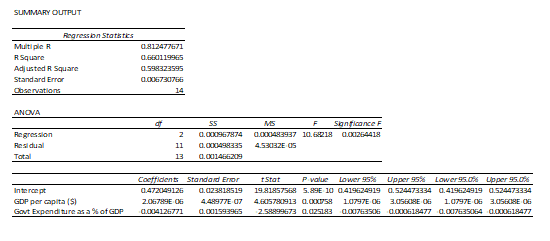
The results of this regression model are highly statistically significant. Both GDP per capita and Govt Expenditure as a % of GDP are statistically significant predictors of income inequality. The R Square value of 66% explains the variation in the dependent variable as a result of the combination of GDP per capita and Govt Expenditure as a % of GDP. The Significance F (0.0026) p-value is much smaller than 0.05 indicating that both independent variables are statistically significant predictors of the outcome.
GDP per capita ($) p value of 0.00076 is highly significant (p<0.05) which shows that every one-dollar increase in GDP per capita is associated with a tiny increase (0.000002068) in the dependent variable when holding Govt Expenditure constant. The Govt Expenditure as a % of GDP p value of 0.0252 is also statistically significant (p<0.05) as my hypothesized indicator for the economic system while holding GDP per capita constant indicating that every one-percentage-point increase in Government Expenditure as a share of GDP is associated with a decrease of 0.00413 in the dependent variable. Higher Government Expenditure as a percent of GDP is significantly associated with a decrease in the dependent variable.
IV: Conclusion
Achieving the global objective of reducing poverty and narrowing the expanding income gap remains highly conditional. While world economic leaders prioritize these goals, the potential for achieving genuine income equality will continue to be heavily influenced by a complex interplay of structural and policy factors. These critical factors include the rate of industrialization and deindustrialization, social mobility, national economic policies, the nature of the prevailing economic system, generational shifts, population growth, a country’s proximity to development centers, and the pace of technological innovation. Ultimately, increasing the chances of significantly mitigating income inequality necessitates a deliberate policy shift toward developing a more inclusive social structure and fundamentally reforming the underlying economic system.
References
References
Alfani, G. (2014). “Economic inequality in northwestern Italy: a long-term view (fourteenth to eighteenth century)”. Dondena Working Paper No. 61, Bocconi University, Milano.
Alfani, G. (2020). Pandemics and asymmetric shocks: Evidence from the history of plague in Europe and the Mediterranean. https://doi.org/10.1484/J.JHES.5.122475
Alvarez-Nogal, C. and Prados de la Escosura, L. (2013). “The rise and fall of Spain (1270–1850),” Economic History Review, vol. 66(1), pages 1-37.
Aloysius Gunadi, B. Vulnerability of Urban Informal Sector: Street Vendors in Yogyakarta, Indonesia. https://core.ac.uk/download/pdf/7301379.pdf
Armend Ademi, (2019). In Traders International Trade Academic Journal » Submission » nexus between income inequality and economic growth: case of the republic of north macedonia. https://dergipark.org.tr/tr/pub/intraders/issue/53571/682142
Credit Suisse. (2021). The Global Wealth Report 2021.
Deaton, A. (1997). The analysis of household surveys: A micro econometric approach to development policy. World Bank library
Dian Herlina, Benyamin Harits, Yaya Mulyana, 2023. Transformation of Information Systems in the Tasikmalaya City Communication and Information Department – EUDL. https://eudl.eu/doi/10.4108/eetsis.3850
Diaz-Bonilla, C.; Sabatino Gonzalez, Carlos Gerardo; Wu, Haoyu; Nguyen, Minh Cong. (2023). April 2023 Update to the Multidimensional Poverty Measure: What is New. World Bank Group.
Dr Marinda Pretorius – University of Johannesburg. https://www.uj.ac.za/members/dr-marinda-pretorius/
Elsevier (1988). Handbook of Development Economics. Volume 1, Pages 203-273.
Gill, I. (2022). Poverty and shared prosperity: Correcting course. World Bank Group.
Gilens, M. (2012). Affluence and Influence. Princeton University Press.
Gould, E.D. and Hijzen, A. (2016). Growing Apart, Losing Trust. The Impact of Inequality on Social Capital. IMF Working Paper WP/16/176.
Grusky, David B. (2014). Social Stratification: Class, Race, and Gender in Sociological Perspective (4th ed.). Boulder: Westview Press.
Hana Babida, 2024.Understanding Culture, Society, and Politics | PPTX | Science. https://fr.slideshare.net/HanaBabida/understanding-culture-society-and-politics-249894840
H. Prince (2014). Macro-level drivers of multidimensional poverty in sub-Saharan Africa: Explaining change in the Human Poverty Index | Prince | African Evaluation Journal. https://aejonline.org/index.php/aej/article/view/73/91
Ibarraran, Pablo; Robles, Marcos; Medellin, Nadin; Saenz, Mayra; Stampini, Marco. (2015). The Poor, the Vulnerable, and the Middle Class: Who is Who?
IMFC backs new trust – Oxfam Aotearoa. https://www.oxfam.org.nz/news-media/media-releases/imf-special-drawing-rights-to-vulnerable-countries/
Kerbo, H. R. (1976). Social Stratification. California Polytechnic State University.
Kirsten, F., Biyase, M., Botha, I., & Pretorius, M. (2023). The Variation Between Subjective and Objective Class Positions in South Africa: The Distance Between Perception and Reality. The Journal of Developing Areas, 57(2), 355–365.
Kuznets, S. (1955). “Economic growth and income inequality”. American Economic Review, March, pp. 1-28.
Lawson, M. & Jacobs, D. (2022). Inequality Kills: The unparalleled action needed to combat unparalleled inequality in the wake of COVID-19. Oxfam.
Lawson, M. et al. (2019). Public Good or Private Wealth. Oxfam.
Lawson, M. & Martin, M. (2018). Commitment to Reducing Inequality Index 2018: A global ranking of governments based on what they are doing to tackle the gap between rich and poor. Oxfam and Development Finance International.
Milanovic, B. (2016). Global inequality: A new approach for the age of globalization. Harvard University Press.
Milanovic, B. (2016). Towards an explanation of inequality in pre-modern societies: the role of colonies and high population density. Munich Personal RePEc Archive. https://mpra.ub.uni-muenchen.de/74877/
Moyer, J., Verhagen, W., Mapes, B., Bohl, D., Xiong, Y., Yang, V., McNeil, K., Solórzano, J., Carter, C., & Hughes, B. (2022). How many people is the COVID-19 pandemic pushing into poverty? A long-term forecast to 2050 with alternative scenarios. PLoS One, 17(7), e0270846.
Oyekola, Isaac; Oyeyipo, Eyitayo. (2018). Introductory Sociology. Obafemi Awolowo University Press.
Perzyńska, J., Perzyńska, J., & Guzowska, M. (2024). The Feminisation of Poverty in European Union Countries—Myth or Reality? Sustainability, 16(17), 7594.
Piketty, Thomas. (2006). The Kuznets Curve: Yesterday and Tomorrow. Oxford Academic
Pickett, K. & Wilkinson, R. (2010). The Spirit Level: Why Equality is Better for Everyone. Penguin Books Ltd
Schotte, S. & Zizania, R. (2021). The livelihood impacts of COVID-19 in urban South Africa: A view from below. World Institute for Development Economic Research (UNU-WIDER).
Simeon Schotte et al. (2018). A poverty dynamics approach to social stratification: The South African case. Science Direct.
Suryahadi, Asep and Sumarto, Sudarno. (2001). The Chronic Poor, the Transient Poor, and the Vulnerable in Indonesia Before and After the Crisis
Tamale, N. (2021). Adding Fuel to the Fire: How IMF demands for austerity will drive up inequality worldwide. Oxfam.
Terano, R., & Fujimoto, A. (2015). The Changing Structure of Farm Household Economies in Malay Rice-Growing Villages. https://core.ac.uk/download/153821354.pdf
The Luxembourg Wealth Study Database, Cross-National Data Centre, Luxembourg.
Törmälehto, Veli-Matti. (2019). Reconciliation of EU statistics on income and living conditions (EU-SILC) data and national accounts.
Vietnam, 2024: Vietnam Hoa Binh Gives Priority to Multidimensional Poverty Reduction. MENA Report.
World Inequality Lab. (2021). World Inequality Report 2022
World Economic Forum. (2021). The Global Risks Report 2021. 16th Edition.
***
“Data: GDP per capita”, part of the following publication: Max Roser, Bertha Rohenkohl, Pablo Arriagada, Joe Hasell, Hannah Ritchie, and Esteban Ortiz-Ospina (2023) – “Economic Growth”. Data adapted from Eurostat, OECD, IMF, and World Bank. Retrieved from https://archive.ourworldindata.org/20250916-100934/grapher/gdp-per-capita-worldbank.html [online resource] (archived on September 16, 2025).
All Data Page:”. Our World in Data (2025). Data adapted from National statistical organizations and central banks, OECD national accounts, and World Bank staff estimates. Retrieved from https://archive.ourworldindata.org/20250916-103535/grapher/agriculture-share-gdp.html [online resource] (archived on September 16, 2025)


Leave a comment